pacman::p_load(sf,tmap,tidyverse)Hands-on_Ex08c
23 Analytical Mapping
23.2.1 Installing and loading packages
23.2.2 Importing data
NGA_wp <- read_rds("Data/NGA_wp.rds")23.3 Basic Choropleth Mapping
23.3.1 Visualising distribution of non-functional water point
p1 <- tm_shape(NGA_wp) +
  tm_polygons(fill = "wp_functional",
             fill.scale = tm_scale_intervals(
               style = "equal",
               n = 10,
               values = "brewer.blues"),
             fill.legend = tm_legend(
               position = c("right", "bottom"))) +
  tm_borders(lwd = 0.1,
             fill_alpha = 1) +
  tm_title("Distribution of functional water point by LGAs")

p2 <- tm_shape(NGA_wp) +
  tm_polygons(fill = "total_wp",
              fill.scale = tm_scale_intervals(
                style = "equal",
                n = 10,
                values = "brewer.blues"),
              fill.legend = tm_legend(
                position = c("right", "bottom"))) +
  tm_borders(lwd = 0.1,
             fill_alpha = 1) +
  tm_title("Distribution of total  water point by LGAs")

tmap_arrange(p2, p1, nrow = 1)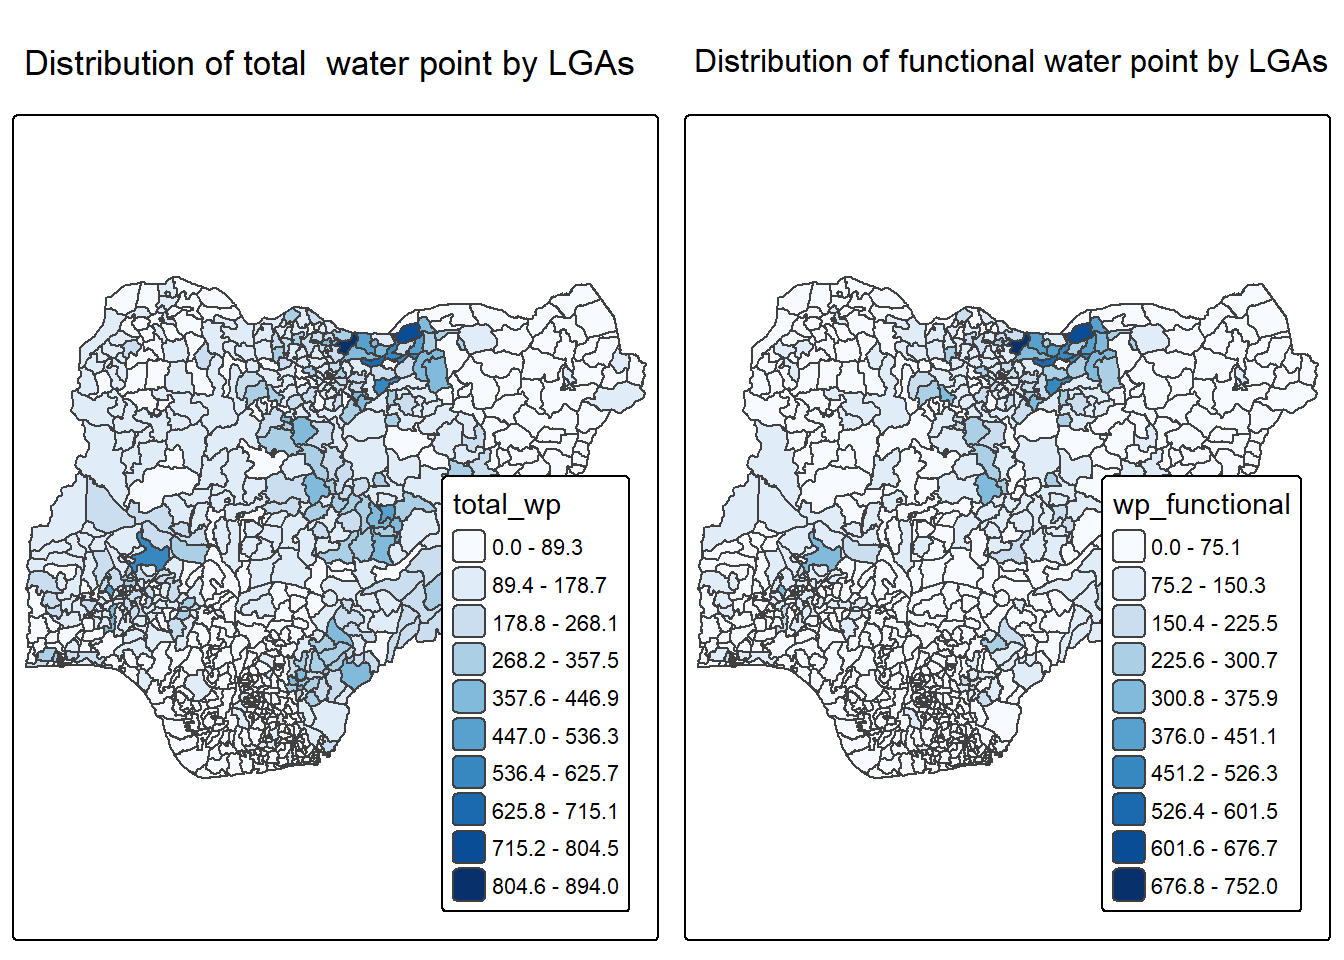
23.4 Choropleth Map for Rates
23.4.1 Deriving Proportion of Functional Water Points and Non-Functional Water Points
NGA_wp <- NGA_wp %>%
  mutate(pct_functional = wp_functional/total_wp) %>%
  mutate(pct_nonfunctional = wp_nonfunctional/total_wp)
23.4.2 Plotting map of rate
tm_shape(NGA_wp) +
  tm_polygons(fill="pct_functional",
              fill.scale = tm_scale_intervals(
                style = "equal",
                n = 10,
                values = "brewer.blues"),
              fill.legend = tm_legend(
                position = c("right", "bottom"))) +
  tm_borders(lwd = 0.1,
             fill_alpha = 1) +
  tm_title("Rate map of functional water point by LGAs")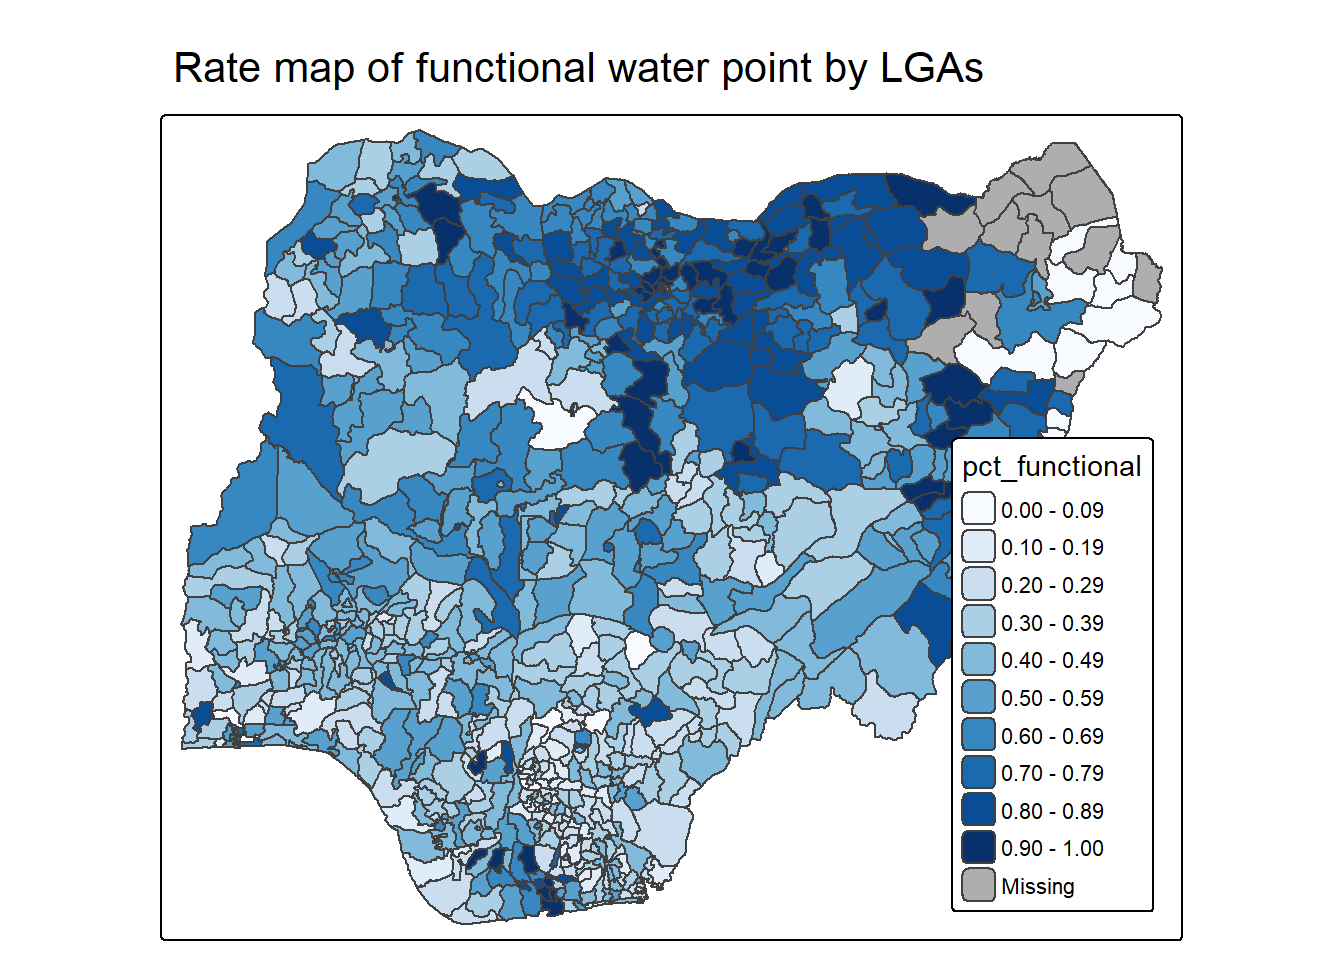
23.5 Extreme Value Maps
23.5.1.1 Data Preparation
# Step 1: Exclude records with NA

NGA_wp <- NGA_wp %>%
  drop_na()

# Step 2: Creating customised classification and extracting values
percent <- c(0,.01,.1,.5,.9,.99,1)
var <- NGA_wp["pct_functional"] %>%
  st_set_geometry(NULL)
quantile(var[,1], percent)
0% 1% 10% 50% 90% 99% 100%
0.0000000 0.0000000 0.2169811 0.4791667 0.8611111 1.0000000 1.0000000 23.5.1.3 Creating the get.var function
get.var <- function(vname,df) {
  v <- df[vname] %>%
    st_set_geometry(NULL)
  v <- unname(v[,1])
  return(v)
}
23.5.1.4 A percentile mapping function
percentmap <- function(vnam, df, legtitle=NA, mtitle="Percentile Map"){
  percent <- c(0,.01,.1,.5,.9,.99,1)
  var <- get.var(vnam, df)
  bperc <- quantile(var, percent)
  tm_shape(df) +
  tm_polygons() +
  tm_shape(df) +
     tm_polygons(vnam,
             title=legtitle,
             breaks=bperc,
             palette="Blues",
          labels=c("< 1%", "1% - 10%", "10% - 50%", "50% - 90%", "90% - 99%", "> 99%"))  +
  tm_borders() +
  tm_layout(main.title = mtitle,
            title.position = c("right","bottom"))
}
23.5.1.5 Test drive the percentile mapping function
percentmap("total_wp", NGA_wp)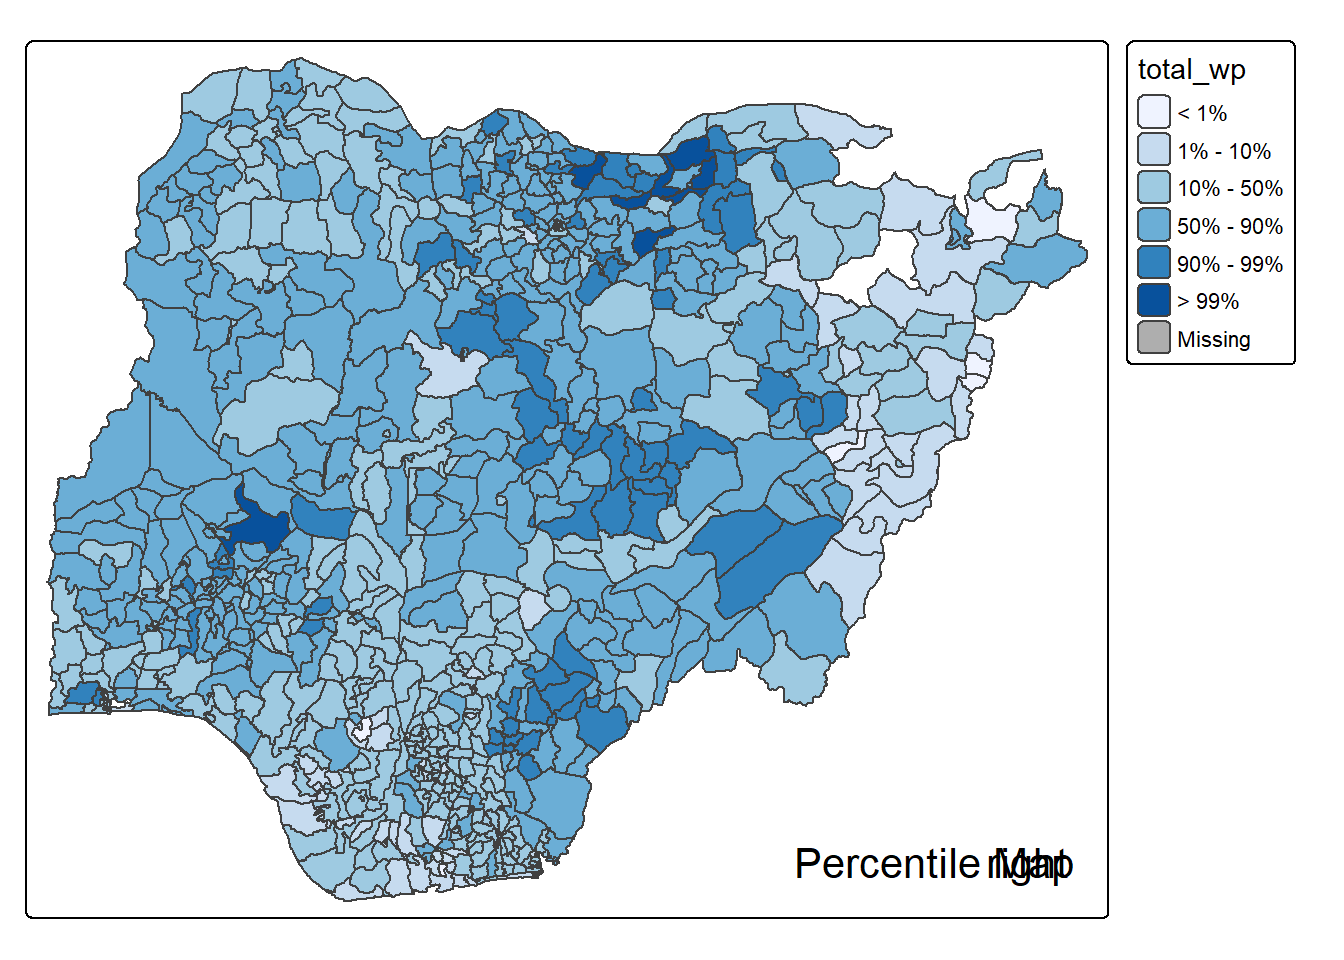
23.5.2 Box map
ggplot(data = NGA_wp,
       aes(x = "",
           y = wp_nonfunctional)) +
  geom_boxplot()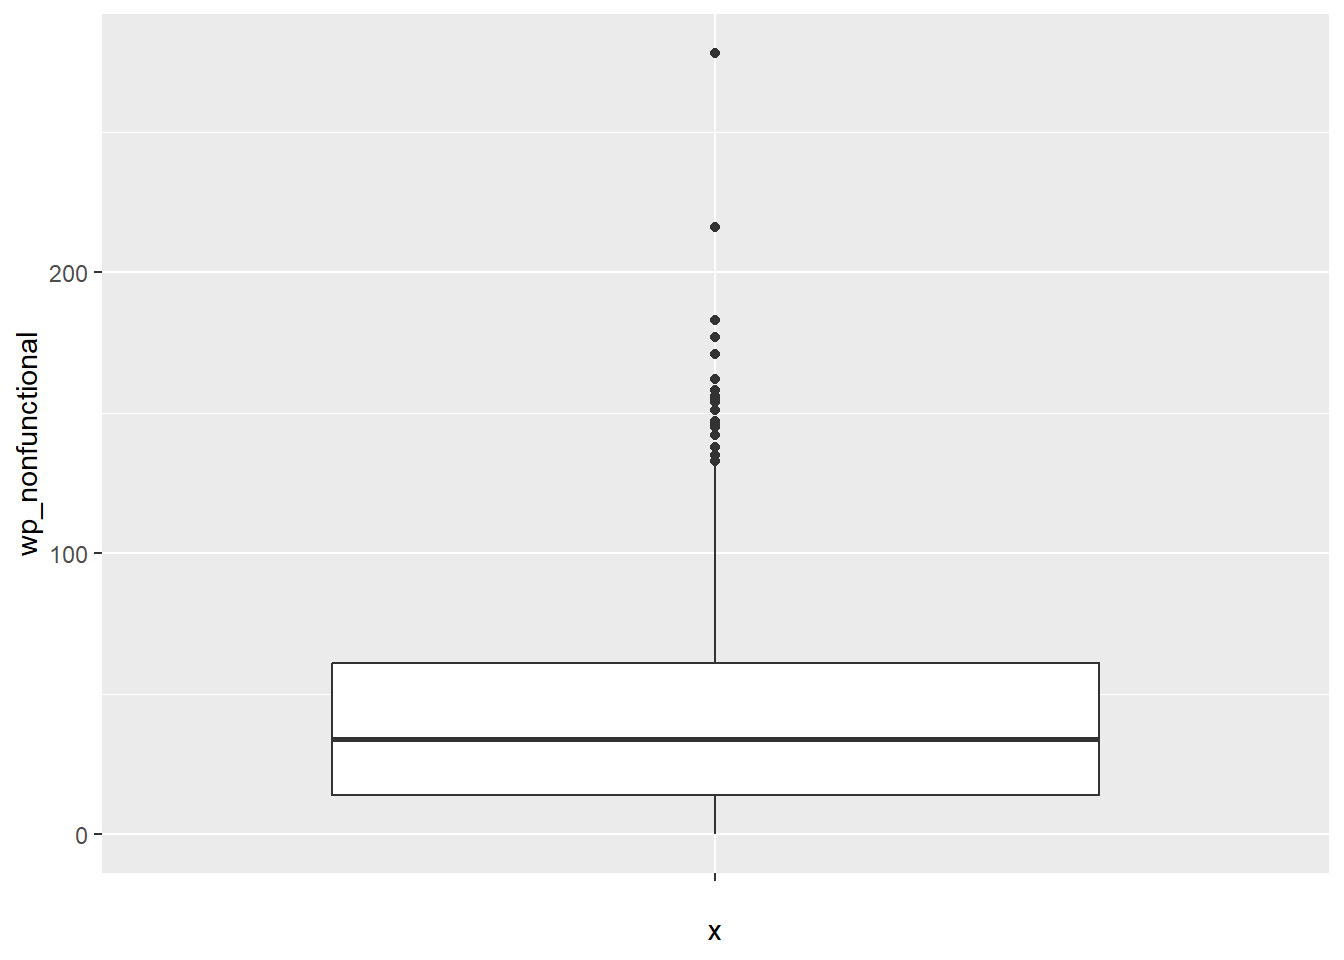
23.5.2.1 Creating the boxbreaks function
The code chunk below is an R function that creating break points for a box map.
arguments:
v: vector with observations
mult: multiplier for IQR (default 1.5)
returns:
- bb: vector with 7 break points compute quartile and fences
boxbreaks <- function(v,mult=1.5) {
  qv <- unname(quantile(v))
  iqr <- qv[4] - qv[2]
  upfence <- qv[4] + mult * iqr
  lofence <- qv[2] - mult * iqr
  # initialize break points vector
  bb <- vector(mode="numeric",length=7)
  # logic for lower and upper fences
  if (lofence < qv[1]) {  # no lower outliers
    bb[1] <- lofence
    bb[2] <- floor(qv[1])
  } else {
    bb[2] <- lofence
    bb[1] <- qv[1]
  }
  if (upfence > qv[5]) { # no upper outliers
    bb[7] <- upfence
    bb[6] <- ceiling(qv[5])
  } else {
    bb[6] <- upfence
    bb[7] <- qv[5]
  }
  bb[3:5] <- qv[2:4]
  return(bb)
}
23.5.2.2 Creating the get.var function
The code chunk below is an R function to extract a variable as a vector out of an sf data frame.
arguments:
vname: variable name (as character, in quotes)
df: name of sf data frame
returns:
- v: vector with values (without a column name)
get.var <- function(vname,df) {
  v <- df[vname] %>% st_set_geometry(NULL)
  v <- unname(v[,1])
  return(v)
}
23.5.2.3 Test drive the newly created function
var <- get.var("wp_nonfunctional", NGA_wp)
boxbreaks(var)
[1] -56.5 0.0 14.0 34.0 61.0 131.5 278.023.5.2.4 Boxmap function
boxmap <- function(vnam, df,
                   legtitle=NA,
                   mtitle="Box Map",
                   mult=1.2){
  var <- get.var(vnam,df)
  bb <- boxbreaks(var)
  tm_shape(df) +
    tm_polygons() +
  tm_shape(df) +
     tm_fill(vnam,title=legtitle,
             breaks=bb,
             palette="Blues",
          labels = c("lower outlier",
                     "< 25%",
                     "25% - 50%",
                     "50% - 75%",
                     "> 75%",
                     "upper outlier"))  +
  tm_borders() +
  tm_layout(main.title = mtitle,
            main.title.size = 1.5,
            legend.outside.position = "right",
            title.position = c("right",
                               "bottom"))
}tmap_mode("plot")
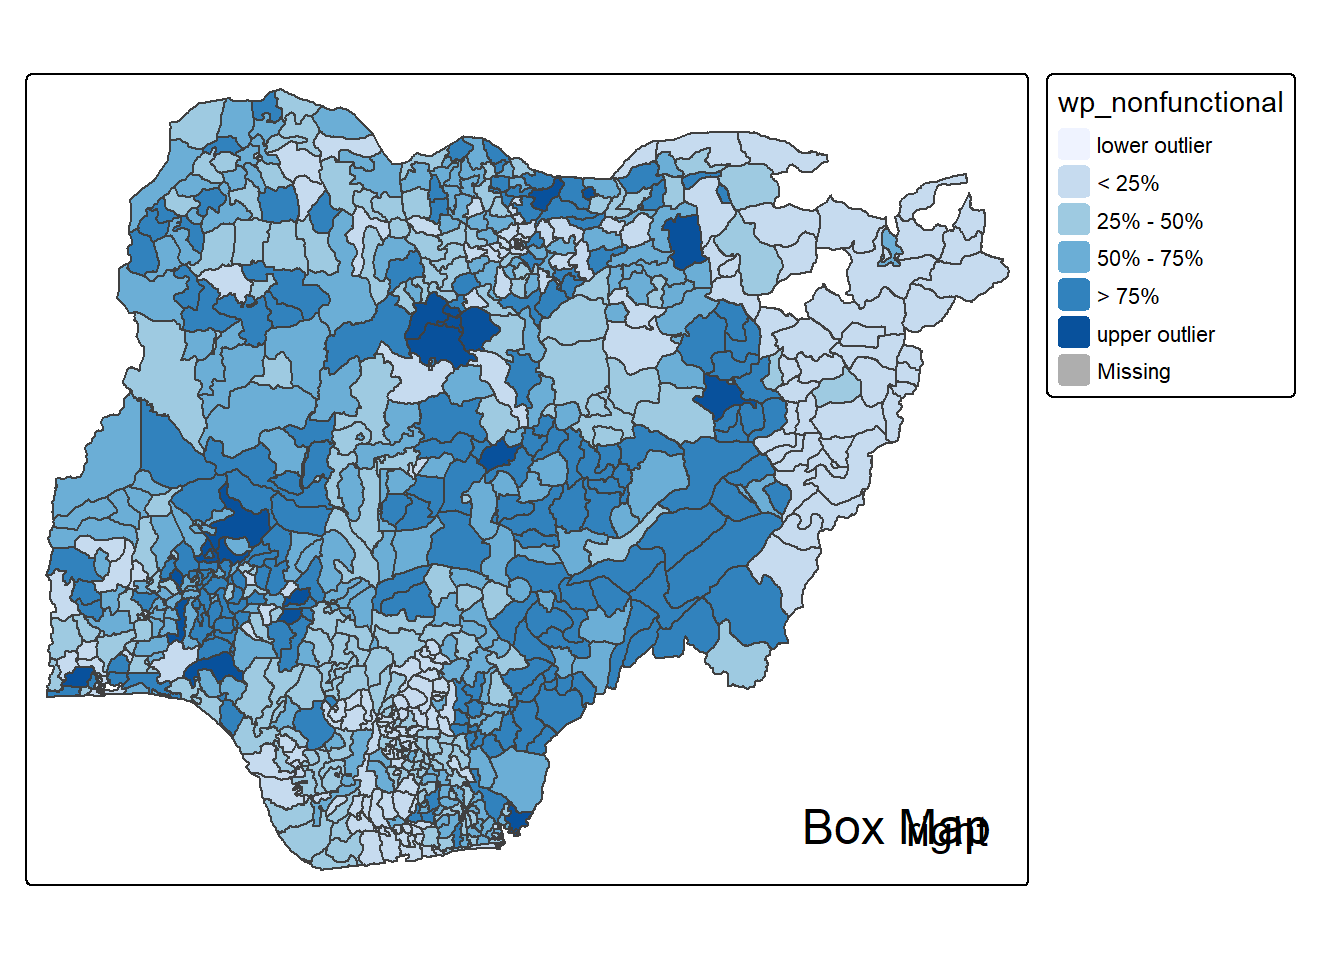
boxmap("wp_nonfunctional", NGA_wp)