pacman::p_load(plotly, ggtern, tidyverse)Hands-on_EX05a
13 Creating Ternary Plot with R
13.2 Installing and launching R packages
ggtern, a ggplot extension specially designed to plot ternary diagrams. The package will be used to plot static ternary plots.
Plotly R, an R package for creating interactive web-based graphs via plotly’s JavaScript graphing library, plotly.js . The plotly R libary contains the ggplotly function, which will convert ggplot2 figures into a Plotly object.
13.3 Data Preparation
13.3.2 Importing Data
#Reading the data into R environment
pop_data <- read_csv("data/respopagsex2000to2018_tidy.csv")
13.3.3 Preparing the Data
#Deriving the young, economy active and old measures
agpop_mutated <- pop_data %>%
  mutate(`Year` = as.character(Year))%>%
  spread(AG, Population) %>%
  mutate(YOUNG = rowSums(.[4:8]))%>%
  mutate(ACTIVE = rowSums(.[9:16]))  %>%
  mutate(OLD = rowSums(.[17:21])) %>%
  mutate(TOTAL = rowSums(.[22:24])) %>%
  filter(Year == 2018)%>%
  filter(TOTAL > 0)
13.4 Plotting Ternary Diagram with R
13.4.1 Plotting a static ternary diagram
#Building the static ternary plot
ggtern(data=agpop_mutated,aes(x=YOUNG,y=ACTIVE, z=OLD)) +
  geom_point()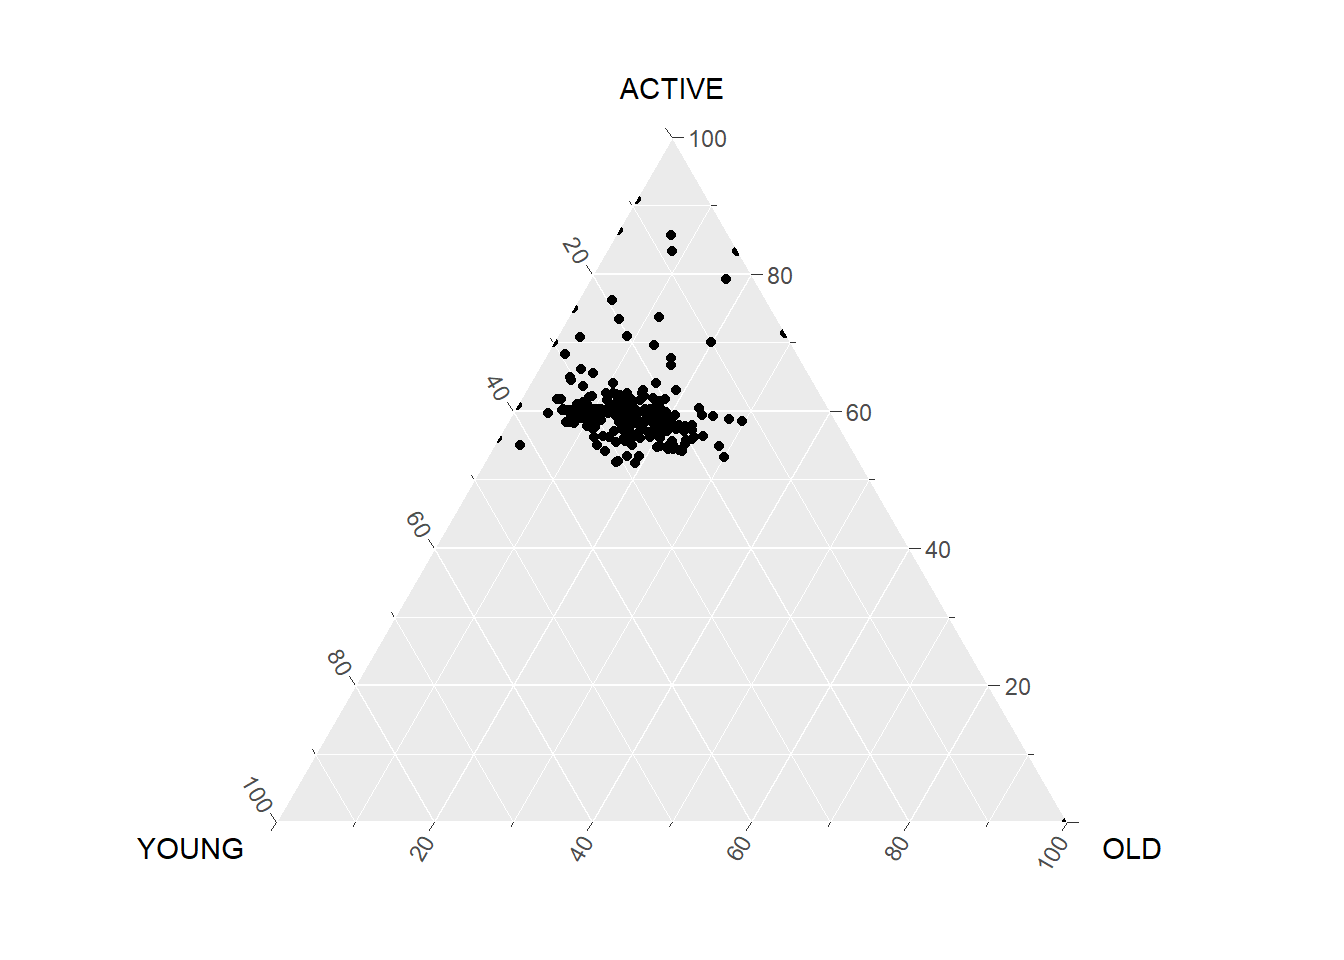
#Building the static ternary plot
ggtern(data=agpop_mutated, aes(x=YOUNG,y=ACTIVE, z=OLD)) +
  geom_point() +
  labs(title="Population structure, 2015") +
  theme_rgbw()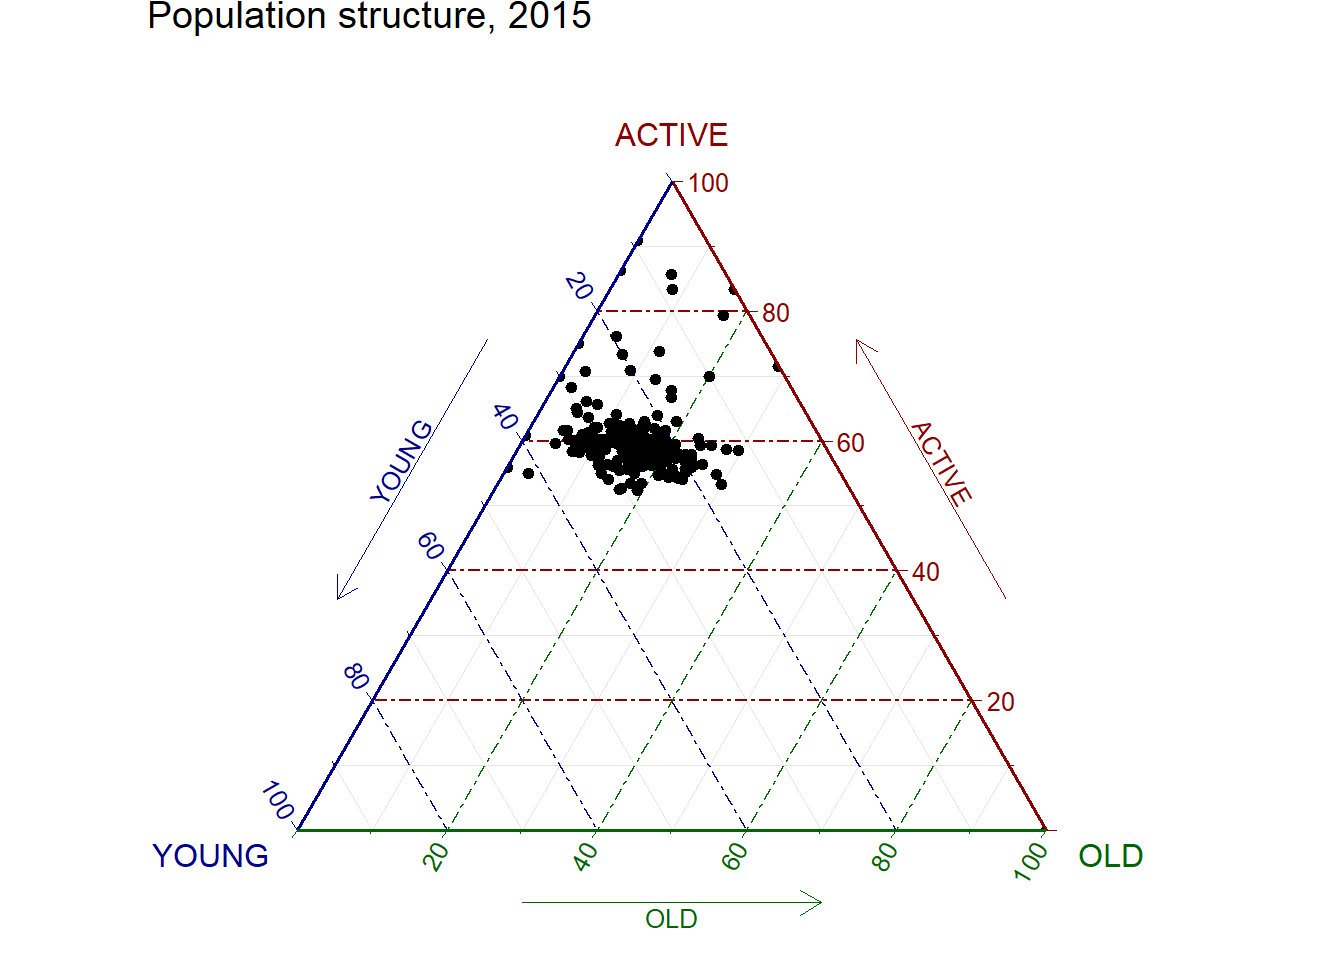
13.4.2 Plotting an interative ternary diagram
# reusable function for creating annotation object
label <- function(txt) {
  list(
    text = txt,
    x = 0.1, y = 1,
    ax = 0, ay = 0,
    xref = "paper", yref = "paper",
    align = "center",
    font = list(family = "serif", size = 15, color = "white"),
    bgcolor = "#b3b3b3", bordercolor = "black", borderwidth = 2
  )
}

# reusable function for axis formatting
axis <- function(txt) {
  list(
    title = txt, tickformat = ".0%", tickfont = list(size = 10)
  )
}

ternaryAxes <- list(
  aaxis = axis("Young"),
  baxis = axis("Active"),
  caxis = axis("Old")
)

# Initiating a plotly visualization
plot_ly(
  agpop_mutated,
  a = ~YOUNG,
  b = ~ACTIVE,
  c = ~OLD,
  color = I("black"),
  type = "scatterternary"
) %>%
  layout(
    annotations = label("Ternary Markers"),
    ternary = ternaryAxes
  )