pacman::p_load(GGally, parallelPlot, tidyverse)Hands-on_EX05d
15 Visual Multivariate Analysis with Parallel Coordinates Plot
15.2 Installing and Launching R Packages
15.3 Data Preparation
wh <- read_csv("data/WHData-2018.csv")Rows: 156 Columns: 12
── Column specification ────────────────────────────────────────────────────────
Delimiter: ","
chr (2): Country, Region
dbl (10): Happiness score, Whisker-high, Whisker-low, Dystopia, GDP per capi...
ℹ Use `spec()` to retrieve the full column specification for this data.
ℹ Specify the column types or set `show_col_types = FALSE` to quiet this message.15.4 Plotting Static Parallel Coordinates Plot
ggparcoord(data = wh,
           columns = c(7:12))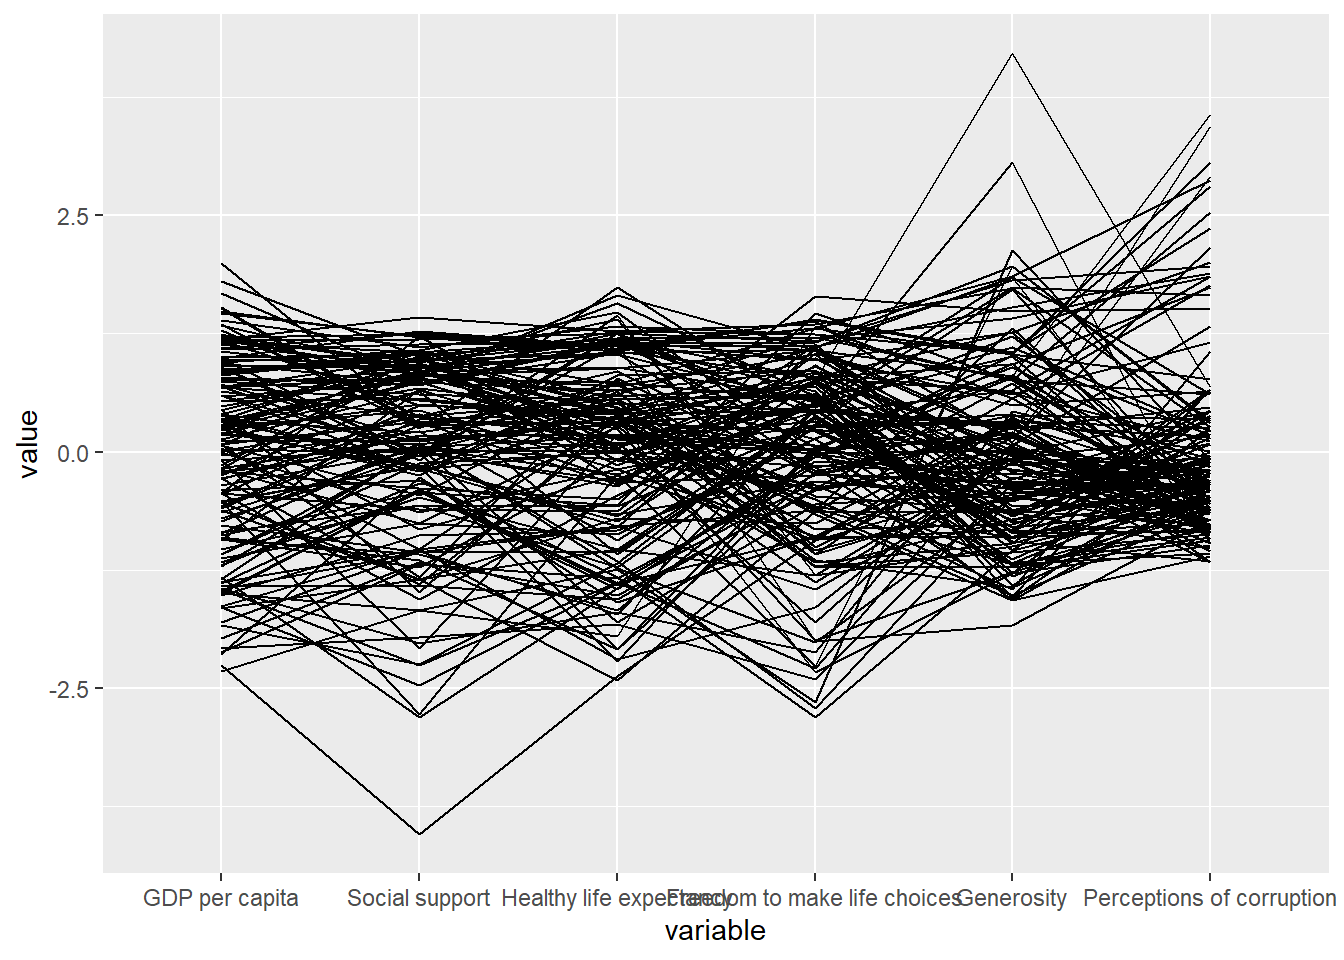
15.4.2 Plotting a parallel coordinates with boxplot
ggparcoord(data = wh,
           columns = c(7:12),
           groupColumn = 2,
           scale = "uniminmax",
           alphaLines = 0.2,
           boxplot = TRUE,
           title = "Parallel Coordinates Plot of World Happines Variables")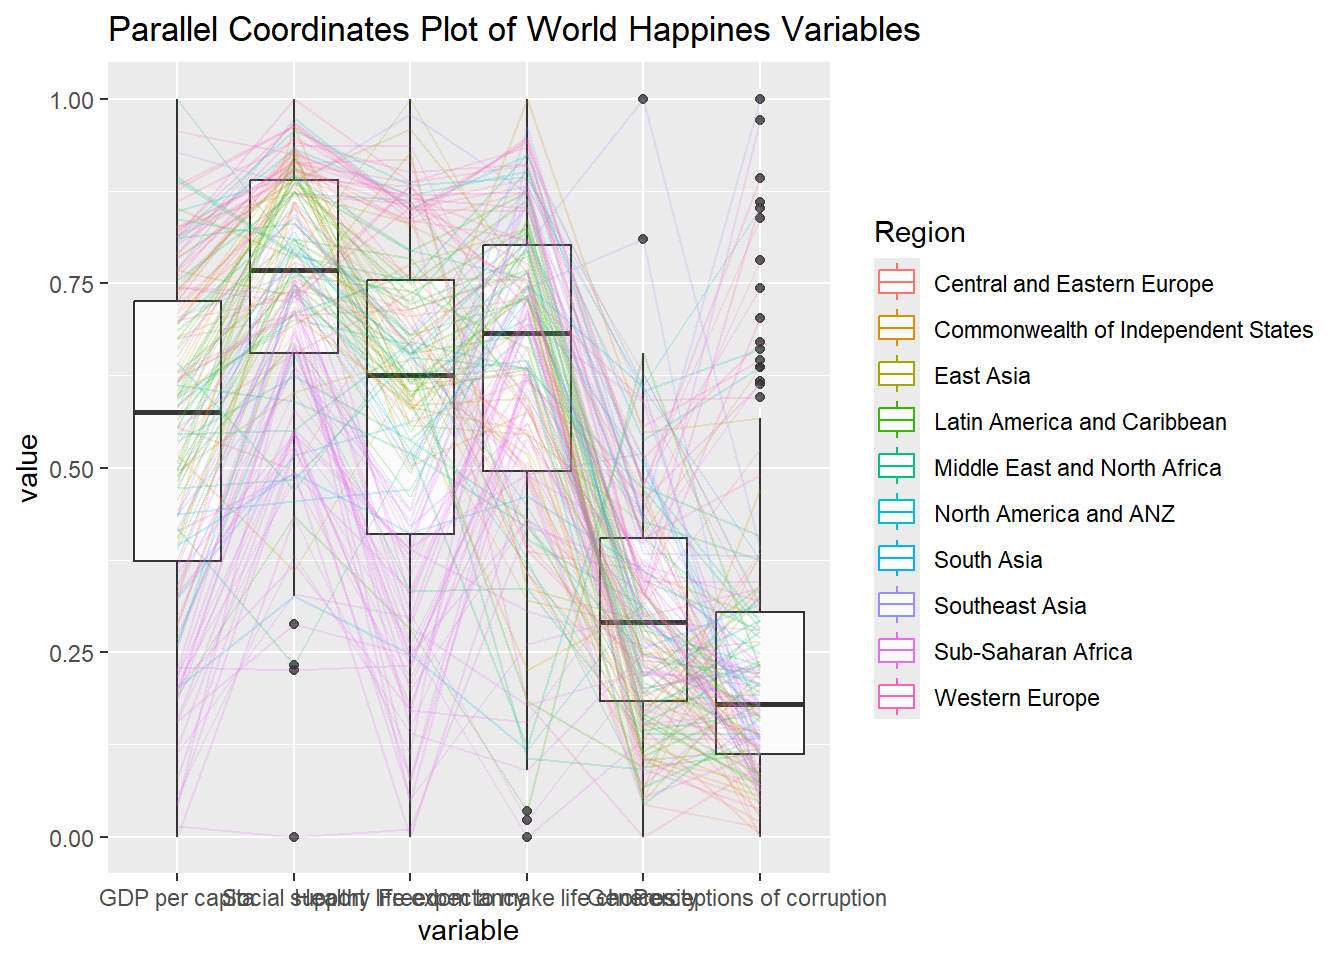
groupColumnargument is used to group the observations (i.e. parallel lines) by using a single variable (i.e. Region) and colour the parallel coordinates lines by region name.scaleargument is used to scale the variables in the parallel coordinate plot by usinguniminmaxmethod. The method univariately scale each variable so the minimum of the variable is zero and the maximum is one.alphaLinesargument is used to reduce the intensity of the line colour to 0.2. The permissible value range is between 0 to 1.boxplotargument is used to turn on the boxplot by using logicalTRUE. The default isFALSE.titleargument is used to provide the parallel coordinates plot a title.
15.4.3 Parallel coordinates with facet
| Elements to change | Theme element |
|---|---|
| Facet titles | strip.text |
| Main plot title | plot.title |
| Axis text | axis.text |
| Axis titles | axis.title |
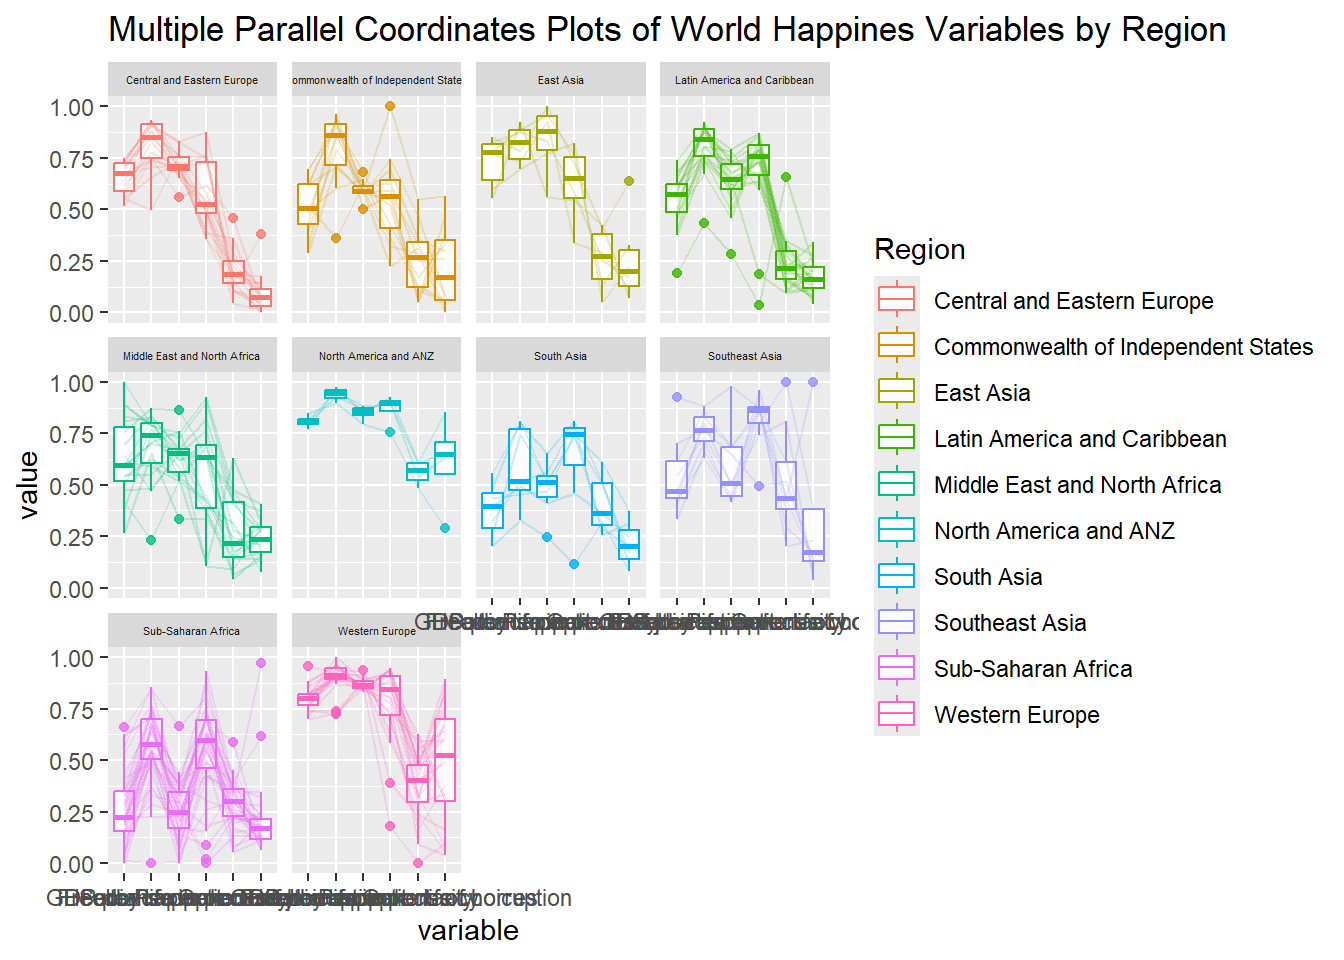
ggparcoord(data = wh, columns = c(7:12), groupColumn = 2, scale = "uniminmax", alphaLines = 0.2, boxplot = TRUE, title = "Multiple Parallel Coordinates Plots of World Happines Variables by Region") + facet_wrap(~ Region)+
theme(strip.text = element_text(size = 4)
)
15.4.4 Rotating x-axis text label
ggparcoord(data = wh,
           columns = c(7:12),
           groupColumn = 2,
           scale = "uniminmax",
           alphaLines = 0.2,
           boxplot = TRUE,
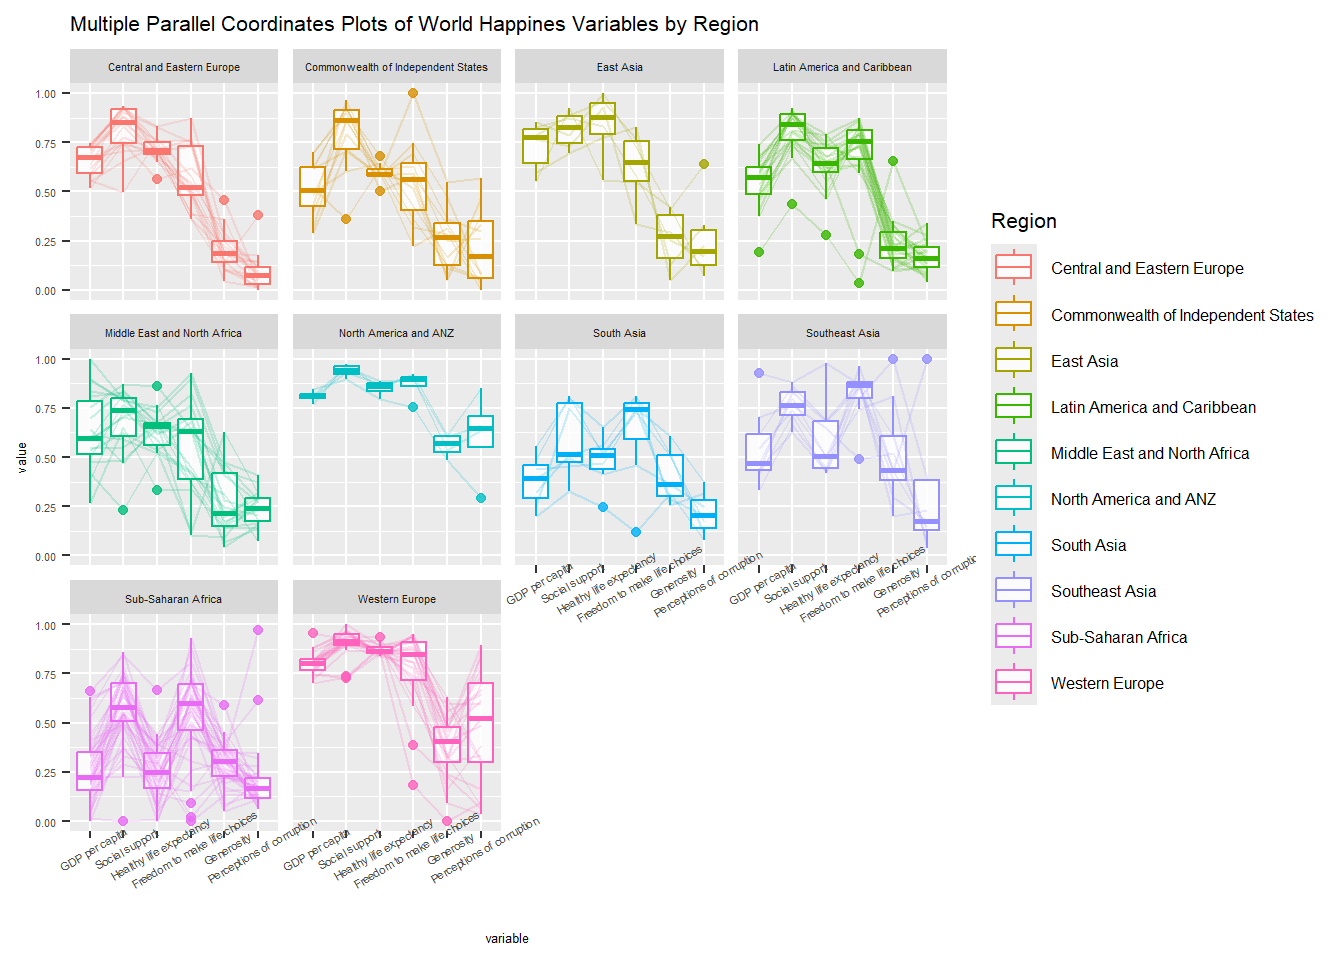
           title = "Multiple Parallel Coordinates Plots of World Happines Variables by Region") +
  facet_wrap(~ Region) +
  theme(axis.text.x = element_text(angle = 30),
        axis.text= element_text(size=4),
        strip.text = element_text(size = 4),
        plot.title = element_text(size = 8),

        legend.text = element_text(size = 6),
        legend.title = element_text(size = 8),
        axis.title = element_text(size = 5),
        axis.title.y = element_text(size = 5)
  )
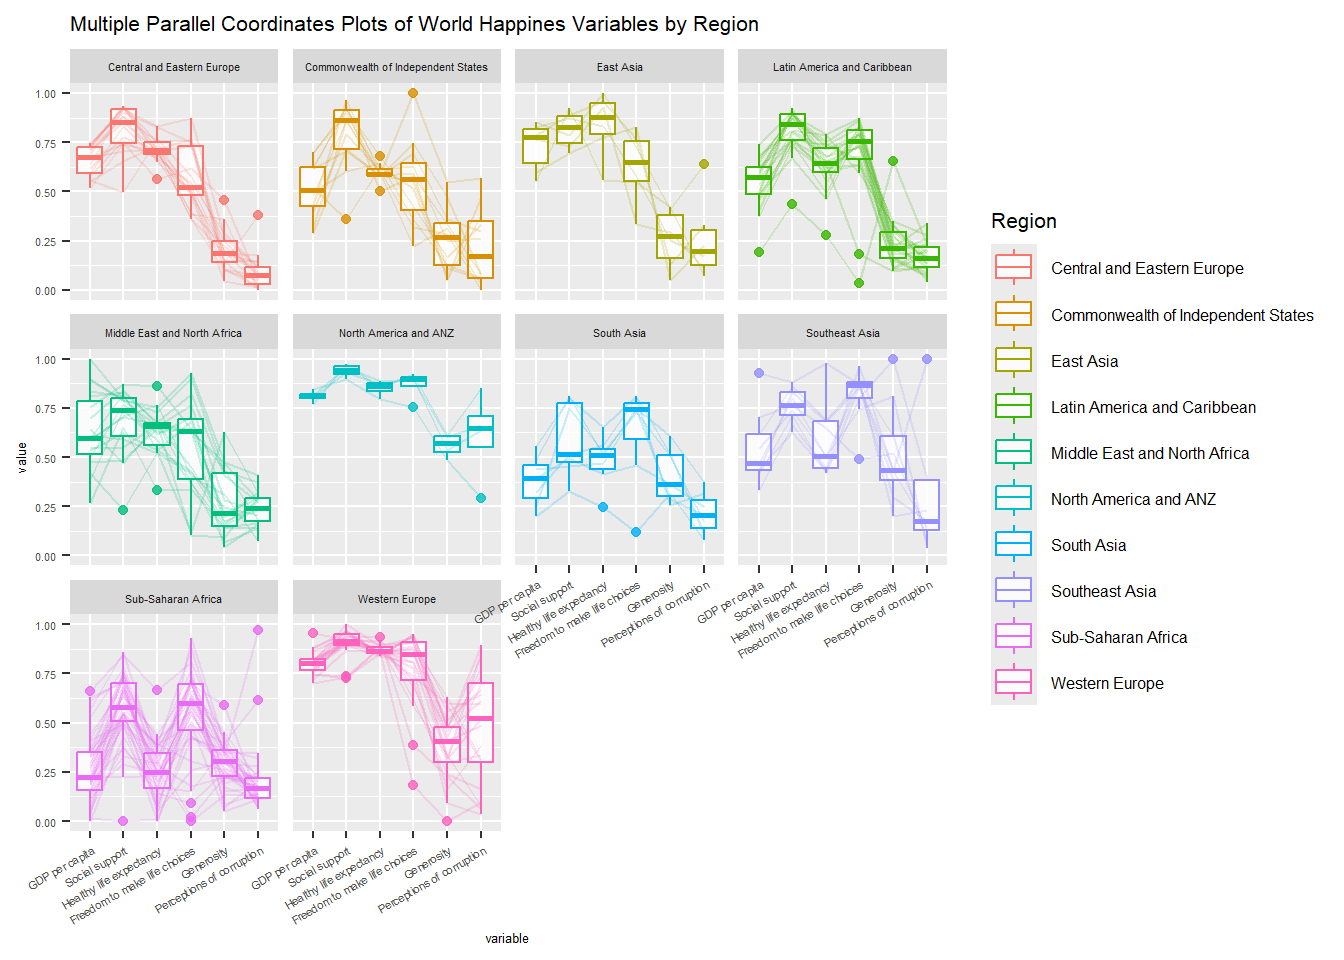
15.4.5 Adjusting the rotated x-axis text label
ggparcoord(data = wh,
           columns = c(7:12),
           groupColumn = 2,
           scale = "uniminmax",
           alphaLines = 0.2,
           boxplot = TRUE,
           title = "Multiple Parallel Coordinates Plots of World Happines Variables by Region") +
  facet_wrap(~ Region) +
  theme(axis.text.x = element_text(angle = 30, hjust=1),
        axis.text= element_text(size=4),
        strip.text = element_text(size = 4),
        plot.title = element_text(size = 8),

        legend.text = element_text(size = 6),
        legend.title = element_text(size = 8),
        axis.title = element_text(size = 5),
        axis.title.y = element_text(size = 5)
  )
15.5 Plotting Interactive Parallel Coordinates Plot: parallelPlot methods
15.5.1 The basic plot
wh <- wh %>%
  select("Happiness score", c(7:12))
parallelPlot(wh,
             width = 320,
             height = 250)
15.5.2 Rotate axis label
parallelPlot(wh,
             rotateTitle = TRUE)
15.5.3 Changing the colour scheme
parallelPlot(wh,
             continuousCS = "YlOrRd",
             rotateTitle = TRUE)
15.5.4 Parallel coordinates plot with histogram
histoVisibility <- rep(TRUE, ncol(wh))
parallelPlot(wh,
             rotateTitle = TRUE,
             histoVisibility = histoVisibility)